Kendall Tau-b Correlation in SPSS
The Kendall tau-b correlation is a nonparametric statistical method that is used to measure the relationship between two ordinal random variables. The Kendall tau-b coefficient measures the change in rank values. If ranks in the second variable increase consistently, a concordance (agreement) count is calculated. If the ranks in the second variable do not increase consistently, a discordance count is calculated. Ranks that do not change are called ties and are taken into calculation.
Introduction to Kendall Tau-b Correlation
When there are several random variables in a study or a data set, some of those variables may be related to each other. For example, imagine a life coach collects data on the frequency of physical exercise (Never, Sometimes, Often) and how optimistic the participants are about their lives (Low, Medium, High). In her anecdotal experience, the life coach believes that there might be a positive relationship between exercise frequency and optimism. Therefore, she tries to quantify this relationship using a correlation test. But what is the appropriate correlation for two ordinal variables?
In this example, the collected data have an order between their values. For example, for the variable Exercise frequency, the order is in such a way that Never < Sometimes < Often. If we assign numerical values to these data, we can order them by number: Never (0) < Sometimes (1) < Often (2). With the same logic, Optimism level can be expressed in ordinal numbers: Low (0) < Medium (1) < High (2). Such data are called ordinal. Kendall tau-b is used when the variables are ordinal, and the data set is small. Therefore, the Kendall-tau correlations are nonparametric statistical tests (using ranks found in the data).
When the data are ordinal (i.e., they are arranged in an order of levels), we can use Kendall tau-b correlation coefficient to measure the relationship between two ordinal variables. Like other correlation coefficients, the Kendall tau-b correlation shows the strength of a correlation (ranging between -1 and +1). A correlation of 0 means the two variables are totally unrelated to each other. A positive correlation means that the values of both variables change together: either increasing together or decreasing together. However, if the values of one variable increase while the values of the other variable decrease, the correlation value will have a negative sign.
In the following sections, we present an example research scenario where the Kendall tau-b correlation method will be used to analyze the data. We will demonstrate how to perform the Kendall tau-b correlation in the SPSS program step-by-step and how to interpret the SPSS results output for Kendall tau-b correlation.
Kendall Tau-b Correlation Example
Is there a relationship between the frequency of exercise (Never, Sometimes, Often) and optimistic outlook (Low, Medium, High)?

A life coach is interested to know if there is a relationship between how often individuals exercise (Never, Sometimes, Often) and how optimistic they are about their lives (Low, Medium, High). The life coach randomly recruits 15 participants who on a questionnaire indicated that they exercise weekly and how often. In addition, the life coach asks them to rate their optimistic outlook on a scale of 0 to 2 (0: low, 1: medium, 2: high level of optimism). Table 1 includes the frequency of exercise and the levels of optimism for five participants in the study.
| Participant | Exercise Frequency | Optimism Level |
|---|---|---|
| Person01 | Never | Low |
| Person02 | Never | Low |
| Person03 | Never | Low |
| Person04 | Never | Medium |
| Person05 | Never | Medium |
| ... | ... |
The health researcher enters the data in the SPSS program in the computer lab. The data for this example can be downloaded in the SPSS format or in CSV format.
Entering Data into SPSS
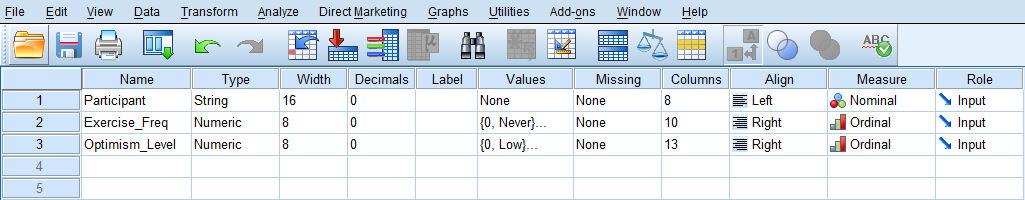
To enter the data in the SPSS program, first we click on the Variable View tab (bottom left) and create three variables: Participant, Exercise_Freq, and Optimism_Level. We specify the following attributes for each variable:
- Participant: Type is string. Width is 16. Measure is Nominal.
- Exercise_Freq: Type is Numeric (Values are 0: Never, 1: Sometimes, 2: Often). Measurement level is Ordinal.
- Optimism_Level: Type is Numeric (Values are 0: Low, 1: Medium, 2: High). Measurement level is Ordinal.
When defining the variables, we must specify both the data type and the measurement level for SPSS. The data type is used by the computer to read the data, while the measurement level is used by the statistical algorithm for computation. In this example, the Participant consists of names or ID's, and is not involved in the computation, so we select "string" as the data type and "nominal" as the measurement level.
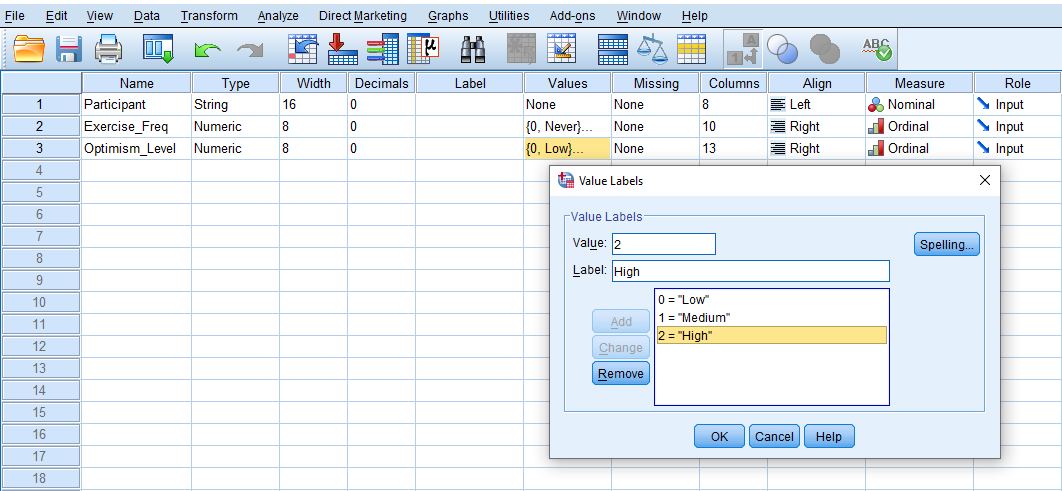
For the variable representing the Exercise frequency, although we use words (Never, Sometimes, Often), we assign numbers to them (e.g., Never = 0, Sometimes = 1, and Often = 2). Therefore, we choose "Numeric" as the data type and select "Ordinal" as the measurement level. To associate numbers with the frequency of exercise, in the Value column, click on the cell in the Exercise_Freq row to open a window. In the Value box, enter 0 and in the Label box, enter "Never," then click "add." Repeat this process with Value 1 for the "Sometimes", and 2 for “Often”. Then add and close the window. Repeat the same for the ordinal variable Optimism_Level (0 for Low, 1 for Medium, and 2 for High). Figure 1 shows how to create these value-label pairs for Exercise frequency and Optimism level.
After creating all the variables, the Variable View panel of SPSS for our dataset should look like Figure 2.
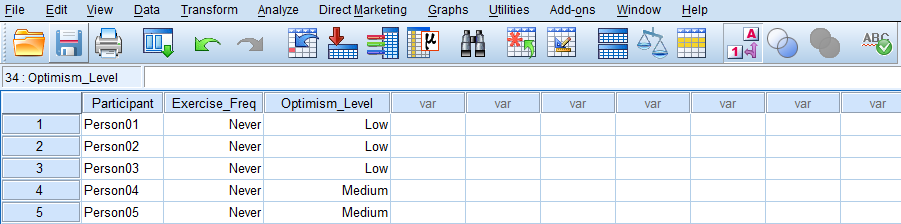
Once the variables are created, we switch to Data View of SPSS program to enter the data into the columns Participant, Exercise_Freq, and Optimism_Level. As specified in the Variable View, for Participant we can enter their names or an ID. For the variables Exercise_Freq and Optimism_Level, we can either directly type the numerical values (0, 1, 2) or their associated labels (e.g., Never, Sometimes, Often). Figure 3 shows how the data for all three variables should look like in the Data View tab.
Now we are ready to conduct the Kendall tau-b correlation in SPSS!
Analysis: Kendall Tau-b Correlation in SPSS
The Kendall Tau-b correlation is a nonparametric statistical method that is used to measure the relationship between two ordinal random variables. In this example research study, a health researcher investigates the possible relationship between the Exercise frequency and Optimism level. To explore this, the researcher collects data from a random sample of 15 participants who report their Exercise frequency (Never, Sometimes, Often) and how optimistic they are about their lives (Low, Medim, High). Because the data set is small (n = 15) and the variables are ordinal, the health researcher uses the Kendall tau-b correlation test to determine the strength of the relationship and whether the correlation is positive or negative.
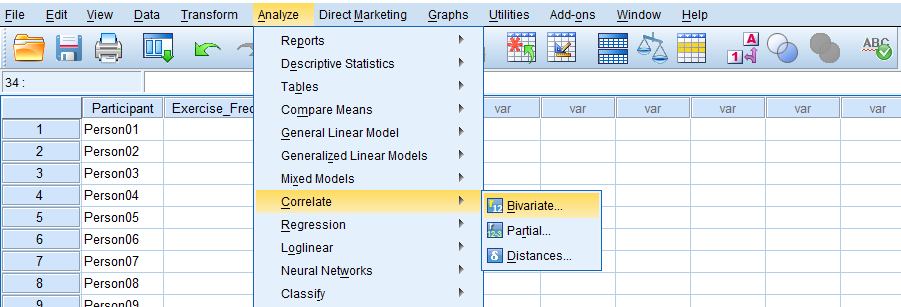
In SPSS, the Kendall tau-b correlation can be accessed through the menu Analyze / Correlate / Bivariate. So, as Figure 4 shows, we click on Analyze and then choose Correlate and then Bivariate (bivariate means two variables).
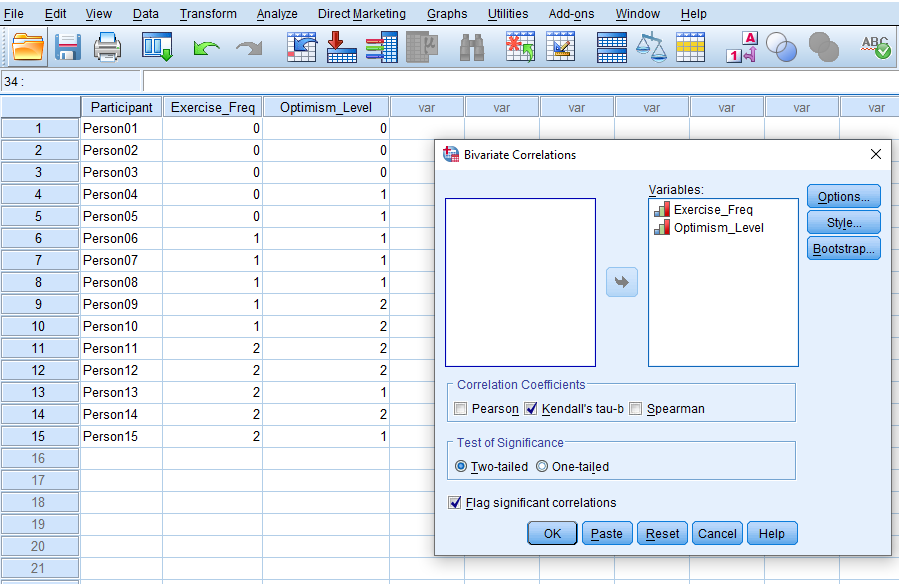
After clicking on Bivariate, a window will appear asking for Variables we want to find a correlation for (Figure 5). We send both Exercise_Freq and Optimism_Level into the Variables box. Next, in this window we check Kendall’s tau-b option (uncheck other methods), choose Two-tailed test of significance and also check Flag significant correlations (to see if the correlation coefficient is statistically significant).
Finally, we click on OK to run the Kendall tau-b correlation test. SPSS will produce the results of the Kendall tau-b correlation test in the Output window.
Interpretation: Kendall tau-b Correlation in SPSS
In our example research study, a health researcher is interested in investigating the relationship between Exercise frequency and Optimism. The researcher uses Kendall tau-b correlation method to investigate the presence and direction of any relationship. After running the Kendall tau-b correlation in SPSS, we get at the (nonparametric) correlations table in SPSS output (Figure 6).
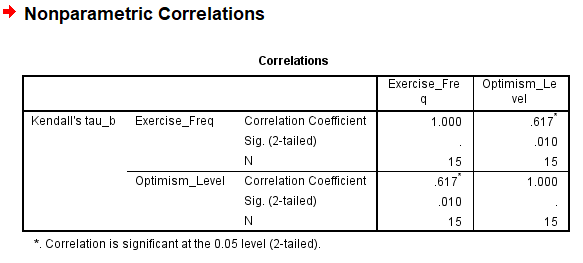
The correlation table in Figure 6 has two rows (Exercise frequency and Optimism level). They both show the Kendall tau-b correlation coefficient. The last column shows that the Kendall tau-b correlation coefficient between Exercise frequency and Optimism level is 0.617 and positive, which is also statistically significant (Sig. 2-tailed = 0.010 or p < 0.05). So, we can conclude that there is a moderate correlation between Exercise frequency and Optimism level.
Reporting the Results of Kendall Tau-b Correlation
In this study, we aimed to investigate the relationship between Exercise frequency and Optimism level. A random sample of 15 participants was selected, and data were collected on their self-reported weekly exercise frequency (Never, Sometimes, Often) and their level of Optimism about life (Low, Medium, High).
The Kendall tau-b correlation analysis revealed a moderate relationship between exercise frequency and optimism level, with a correlation coefficient of 0.617, indicating a significant association. These findings highlight the potential impact of exercise routines on an optimistic outlook on life.