Pearson Correlation in SPSS
The Pearson correlation is a statistical method that measures the linear relationship between two continuous variables (interval or ratio scales variables). The Pearson correlation coefficient value ranges from -1 to 1. Pearson correlation coefficients near -1 or 1 show very high correlation and values close to zero show very weak correlations. A correlation coefficient of zero means there is no correlation between the two variables. The Pearson correlation coefficient (r) is also known as Pearson’s product moment correlation.
Introduction to Pearson Correlation
When a study or dataset involves multiple random variables, some of them might exhibit relationships with each other. For instance, consider data on the number of hours participants spend exercising and their body fat levels. Intuitively, the more time individuals dedicate to exercise, the lower their body fat tends to be. This suggests a correlation between hours of exercise and body fat levels.
The correlation between two variables can be measured using a correlation coefficient, and the method employed depends on the data's characteristics. If both variables are continuous (or measured on an interval or ratio scale) and have a linear relationship, the Pearson correlation can be used to assess the correlation's strength, direction, and significance.
The magnitude of a correlation indicates how closely the two variables are related and ranges from -1 to +1. A correlation of 0 means the variables are entirely unrelated. Correlation also has a direction: it can be positive or negative. A positive correlation signifies that as the value of one variable rises, so does the other, or they decrease together. Conversely, a negative correlation means that as one variable's value increases, the other decreases. Note that a negative correlation does not imply a weak relationship; it simply indicates opposite tendencies between the variables. Lastly, while a correlation can be statistically significant, its magnitude is generally of greater importance. This is because a near-zero correlation coefficient (e.g., 0.03) might still reach statistical significance but may lack practical significance or meaningfulness.
In the following sections, we present an example research scenario where the Pearson correlation will be used to analyze the data. We will demonstrate how to perform the Pearson correlation in the SPSS program step-by-step and how to interpret the SPSS results output for Pearson correlation.
Pearson Correlation Example
Is there a relationship between the number of weekly study hours and test scores?

A high school teacher aims to explore the relationship between the hours students devote to studying for a test and the scores they attain. To conduct this study, the teacher selects a random sample of 65 students from the school district and collects data on the amount of time they spent preparing for the test. With the gathered information, the teacher can use a Pearson correlation test to evaluate the strength and direction of the relationship, as well as determine its statistical significance. Table 1 provides the test scores of five students from the study.
| Student | Study Hours | Test Score |
|---|---|---|
| Student01 | 31 | 70 |
| Student02 | 32 | 75 |
| Student03 | 44 | 100 |
| Student04 | 32 | 80 |
| Student05 | 28 | 83 |
| ... | ... |
The teacher enters the data in the SPSS program in the computer lab. The data for this example can be downloaded in the SPSS format or in CSV format.
Entering Data into SPSS
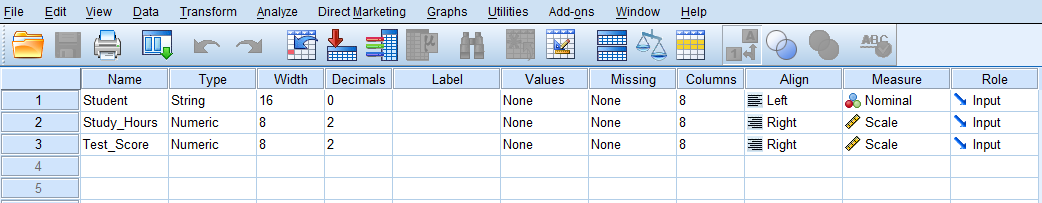
To enter the data in the SPSS program, first we click on the Variable View tab (bottom left) and create two variables under name column: Student, Study_Hours, and Test_Score. We specify the following attributes for each variable:
- Student: Type is string. Width is 16. Measure is Nominal.
- Study_Hours: Type is Numeric. Measure is Scale.
- Test_Score: Type is Numeric. Measure is Scale.
When defining the variables, specify both the data type and the measurement level for SPSS. The data type is used by the program to interpret the data, while the measurement level informs the statistical algorithm for computation.
The Student variable consists of student names or IDs and is not included in computation; therefore, select "String" as the data type and "Nominal" as the measurement level. Increase the Width of the Student variable to 16 so that the full names for longer strings are shown. For the two continuous variables Study_Hours and Test_Score we choose Numeric for their types and Scale for their measurements. SPSS uses the term scale for interval and ratio measurement levels. After creating all variables, the Variable View panel of SPSS for our dataset should look like Figure 1.
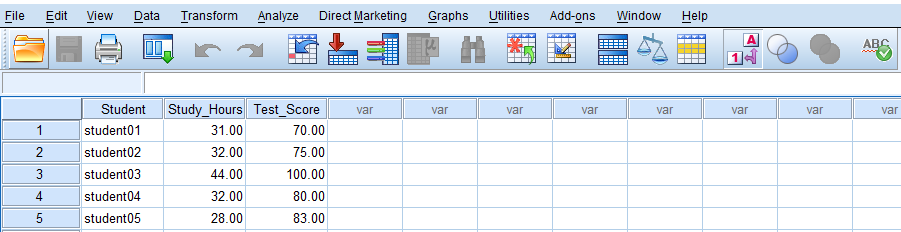
Once the variables are created, we can enter the data into the columns Student, Study_Hours, and Test_Score in the Data View tab of SPSS program. For Student, we can enter their names or an ID. For the variable Study_Hours, we enter the number of hours each student reports studying on average. Finally, we enter the test scores in Test_Score column for each student. Figure 2 shows how the data for all three variables should look like in the Data View tab.
Now we are ready to conduct a Pearson correlation test in SPSS!
Analysis: Pearson Correlation in SPSS
A Pearson correlation test is a statistical technique used to measure the strength and direction of the linear relationship between two continuous variables. In our example research study, a teacher is interested in investigating the relationship between the number of weekly hours students spend studying and their test scores. To explore this, the teacher collects data on the study hours and test scores from a random sample of 65 students. By using the Pearson correlation test, the teacher can determine the strength of the relationship, whether the correlation is positive or negative, and if the relationship is statistically significant.
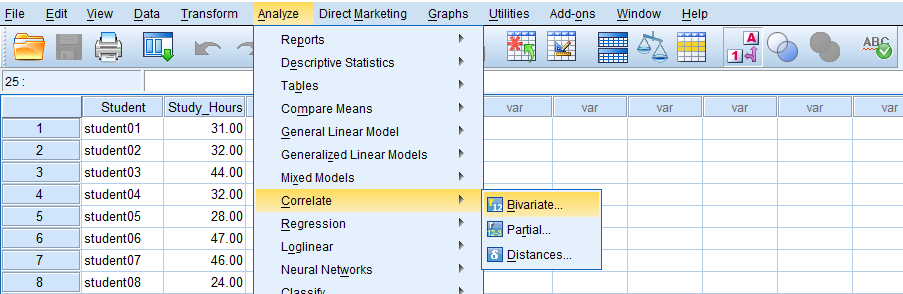
In SPSS, the Pearson correlation can be accessed through the menu Analyze / Correlate / Bivariate. So, as Figure 3 shows, we click on Analyze and then choose Correlate and then Bivariate (bivariate means two variables).
After clicking on Bivariate, a window will appear asking for Variables we want to find a correlation for (Figure 4). We send both Study_Hours and Test_Score into the Variables box. Next, in this window we check Pearson, choose Two-tailed test of significance and also check Flag significant correlations (to see if the correlation coefficient is statistically significant).
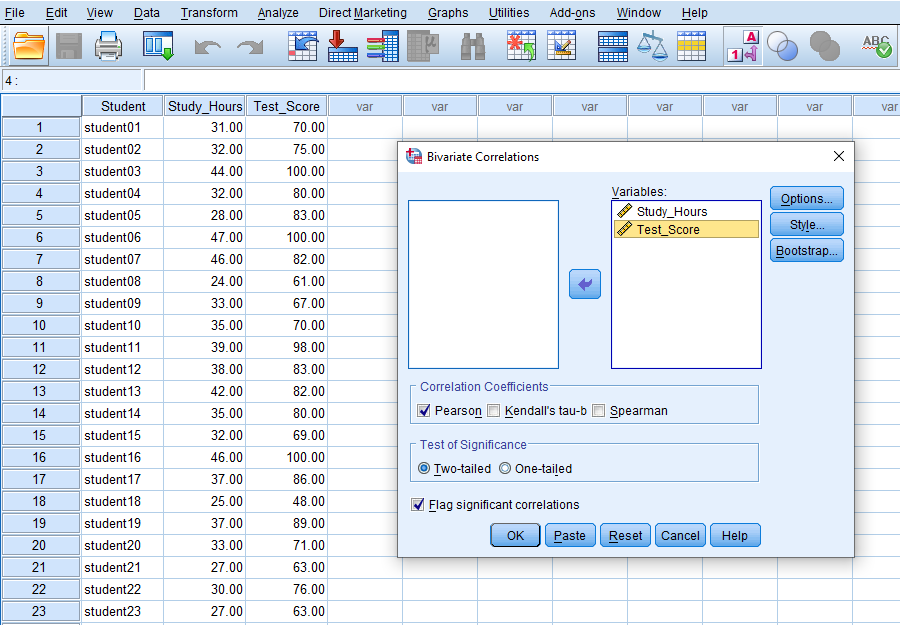
Finally, we click on OK to run the Pearson correlation test. SPSS will produce the results of the Pearson correlation test in the Output window.
Interpretation: Pearson Correlation in SPSS
In our example research study, a teacher is interested in investigating the relationship between the number of weekly hours students spend studying and their test scores. Because the two variables are both continuous, the teacher uses Pearson correlation test to investigate the presence and direction of any correlation. Figure 5 is a scatter plot showing the relationship between Study hours and Test scores.
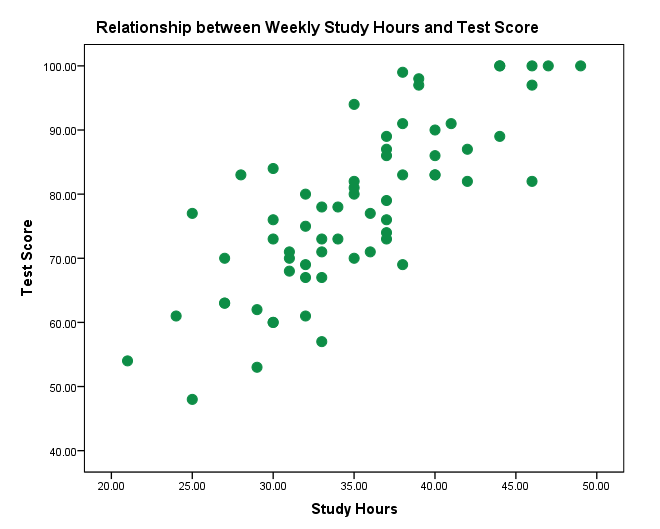
As the scatter plot in Figure 5 hints at, there seems to be a linear relationship between Study hours and Test scores. The relationship is positive, meaning as the number of weekly study hours increases the test scores on average increase as well. We also want to know the strength of the relationship and if it is statistically significant. So, we look at the correlation table in the SPSS output (Figure 6).
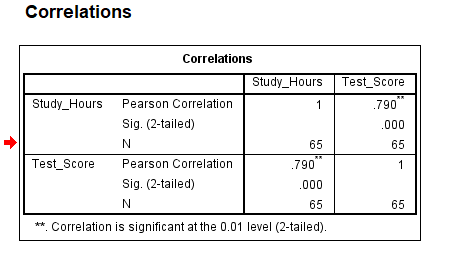
The correlation table in Figure 6 has two rows, but they are the same variables (Study hours and Test scores). They both show the Pearson correlation between Study hours and Test scores. The last column shows that the Pearson correlation between Study hours and Test scores is 0.79 and positive, which is also statistically significant (Sig. 2-tailed = 0.000). So, we can conclude that there is a high correlation between weekly study hours and test scores. As student study more, their test scores increase on average.
Reporting the Results of Pearson Correlation
In this research, we aimed to investigate the relationship between the number of hours students dedicate to studying and their test scores. A random sample of 65 students was selected, and data were collected on the number of hours they spent preparing for an upcoming test and the scores they achieved.
The Pearson correlation analysis revealed a strong positive relationship between study hours and test scores, with a correlation coefficient of 0.79. This indicates that as students spend more hours studying, their test scores tend to improve significantly.
The findings underscore the importance of dedicated study time in achieving better academic outcomes. A strong correlation of this magnitude suggests that students who allocate more time to preparation are more likely to perform well. These results provide valuable insights for educators and students alike, highlighting the potential benefits of effective time management and study practices.