Independent Samples T-Test in SPSS
An independent samples t-test is a statistical method used to compare two distinct groups on a common measure using their mean scores on that measure. It is called independent samples because the observations in each group have been generated and collected independently of the other group. In this chapter, we will learn about independent samples t-test and how to perform an independent samples t-test in SPSS program.
Introduction to Independent Samples T-Test
Researchers often gather data from two distinct groups, such as male and female participants, patients receiving Medication A versus Medication B, students in online courses compared to those in in-person classes, or individuals who drink compared to those who do not. In these comparative studies, the goal is to determine whether there is an average difference between the two groups on a specific measure (e.g., reading score, blood pressure, motivation and engagement, or reaction time) and if this difference is statistically significant. Since each participant is assigned to only one group (e.g., either the online course or the in-person course), they form independent samples, and their data are not related to the other group.
The researcher measures each group and calculates the mean for each group's measure, such as the performance of students in online versus in-person programs. By comparing these mean values, the researcher aims to determine if the difference between them is substantial enough (by statistical criteria) to support a definitive conclusion. In such research designs, an independent samples t-test is employed to assess if the mean scores between the two unrelated groups differ significantly. The statistical criterion for concluding a significant difference relies on the T distribution, which is why this method is called a t-test.
In the following sections, we present an example research scenario where an independent samples t-test will be used to analyze the data. We will demonstrate how to perform an independent samples t-test in the SPSS program step-by-step and how to interpret the SPSS results output for the independent samples t-test.
Independent Samples T-Test Example
Does a new teaching method have an effect on students' math improvement?
A middle school teacher conducted a study to determine which teaching method would yield better results in student math achievement. The study compared two teaching methods: a new method and a traditional method. The teacher randomly selected 60 students and assigned them randomly to either the new teaching method or the traditional method. After teaching both groups for one year, the teacher administered a math test and collected the students' scores. The teacher aims to determine which teaching method was more effective by comparing the mean math scores of the two groups. Given the study design, with two independent groups (new and traditional methods) and a continuous measure (math test scores), an independent samples t-test is suitable for addressing the research question. Table 1 presents the math test scores of five students.
| Student | Group | Score |
|---|---|---|
| iSaRx9 | New method | 97 |
| XVSdWW | New method | 87 |
| tuV527 | New method | 85 |
| aX39F3 | Traditional method | 84 |
| y9kpMT | Traditional method | 87 |
| ... | ... | ... |
The teacher enters the data in the SPSS program in the school computer lab. The data for this example can be downloaded in the SPSS format or in CSV format.
Entering Data into SPSS
To enter the data in the SPSS program, first we click on the Variable View tab (bottom left) and create three variables under name: Student, Group, Score. We specify the following attributes for each variable:
- Student: Data type is String. Measurement level is Nominal
- Group: Data type is Numeric (Values are 1: New method, 2: Traditional method). Measurement level is Nominal
- Score: Data type is Numeric. Measurement level is Scale
When defining the variables, we must specify both the data type and the measurement level for SPSS. The data type is used by the computer to read the data, while the measurement level is used by the statistical algorithm for computation. In this example, the Student ID consists of names and is not involved in the computation, so we select "string" as the data type and "nominal" as the measurement level.
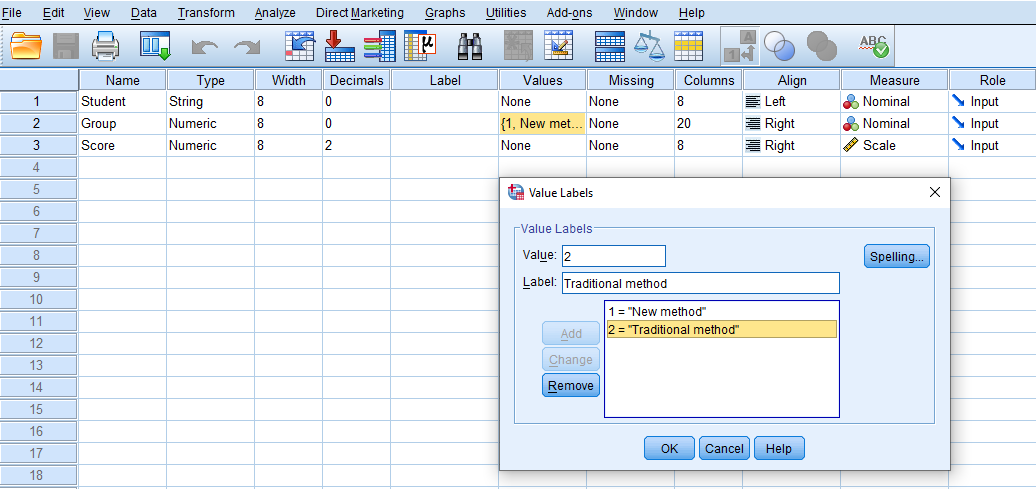
For the variable representing the Teaching Method, although they are names of methods (New and Traditional), we assign numbers to them (e.g., New = 1, Traditional = 2). Therefore, we choose "Numeric" as the data type but select "Nominal" as the measurement level. To associate numbers with the types of teaching methods, in the Value column, click on the cell in the Method row to open a window. In the Value box, enter 1 and in the Label box, enter "New Method," then click "add." Repeat this process with Value 2 for the "Traditional Method" group, then add and close the window. Associating numbers with nominal data is useful for computation and model building (e.g., in regression analysis with dummy variables). Figure 1 shows how to create Group levels (New method and Traditional method) and assign numbers to them.
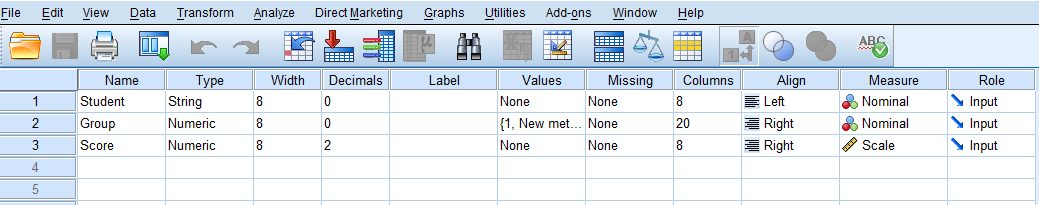
The data type for the variable Math Score is also "Numeric," and for the measurement level, we select "Scale." After creating all variables, the Variable View panel of SPSS for our dataset should look like Figure 2.
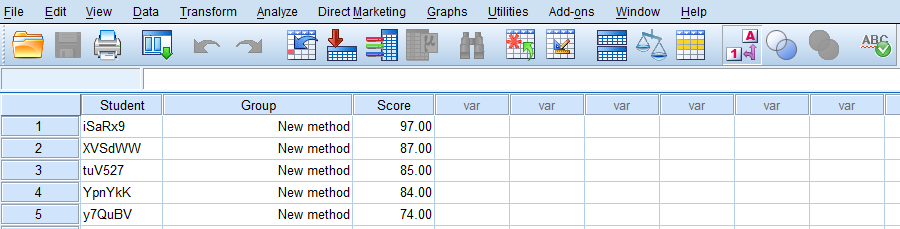
Once the variables are created, we can enter the data in the columns Student, Group, and Score. As specified in the Variable View, for Student we can enter their names or an ID. For the variable Group, we can either directly type the group name they belong to, for example, “New method” / “Traditional method” or the values we assigned them during the variable creation step in the Variable View tab. In the latter case, we can enter 1 for “New method” and 2 for the “Traditional method”. Finally, we enter the math score for each student. Figure 3 shows how the data for all three variables should look like in the Data View tab.
Now we are ready to conduct an independent samples t-test in SPSS.
Analysis: Independent Samples T-test in SPSS
An independent samples t-test is a statistical method to compare means between two groups. In our study scenario, the researcher was interested in knowing if the New math teaching method has any significant effect on the students' math scores compared to the Traditional teaching method. There are two groups of students randomly selected and randomly assigned to the New method or the Traditional method. We can compare the students' mean scores on the math test using the independent samples t-test.
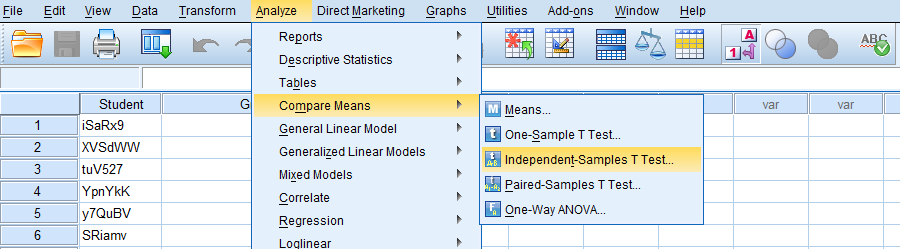
In SPSS, the independent samples t-test can be accessed in the menu Analyze/Compare Means/Independent-Samples T test. So, as Figure 4 demonstrates, we click on Analyze and then choose Compare Means and then Independent-Samples T Test.
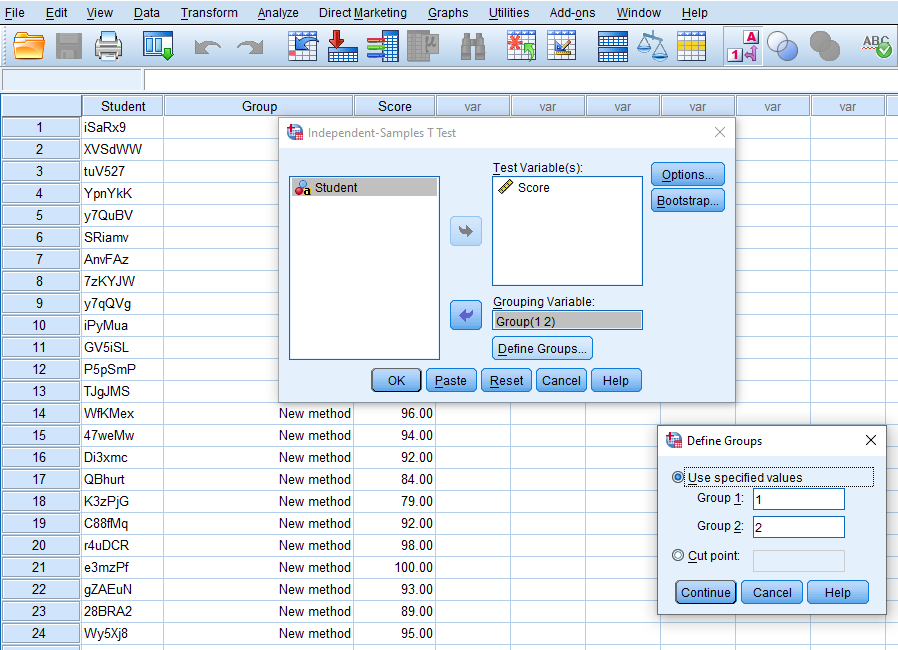
After clicking on Independent-Samples T Test, a window will appear prompting for Test Variable(s) and Grouping Variable. The Test Variable is the measure or the dependent variable, which in this case is the Math Score. So, we send the Score variable into the Test Variable(s) box. Next, we choose Group as the Grouping Variable and click the Define Groups button, which opens a window for specifying the groups. As mentioned earlier, SPSS prefers numbers over group names, so in the Define Groups box, we enter 1 (for the New Teaching Method) and 2 (for the Traditional Method) groups. Figure 5 shows how to define our grouping variable.
Afterward, we press Continue and then OK in the larger window to perform the independent samples t-test.
Interpretation: Independent Samples T-test in SPSS
In this study, the researcher was interested in investigating the effectiveness of the New teaching method on students' math scores compared to the Traditional method in a separate group of students. An independent samples t-test was performed to compare the mean scores on a valid and reliable mathematics test. The results of the SPSS independent samples t-test include a table for descriptive statistics (Group Statistics) and a table for the Independent Samples Test results. Figure 6 shows the Group Statistics table that includes the sample size in each group (N), the mean on the math test scores (Mean), the standard deviation from the mean, and the standard error of the mean.
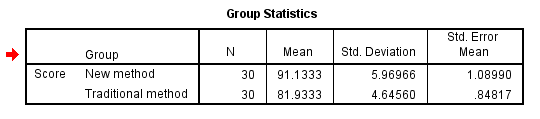
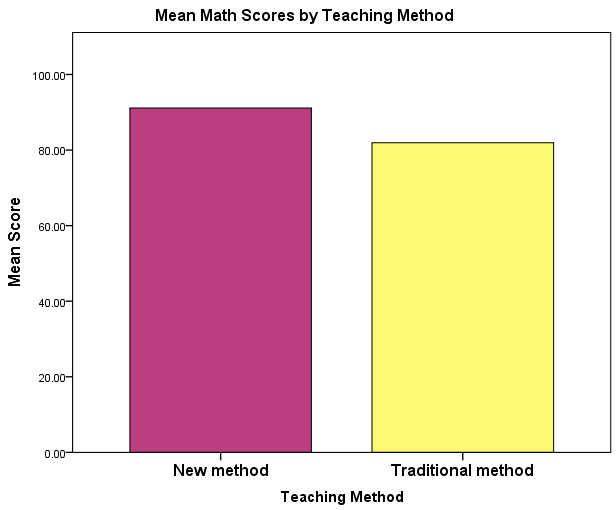
The first column in the descriptive statistics (Group Statistics) table lists the measure (Score) and the names of the two teaching methods (Groups), "New method" and "Traditional method." Each row provides descriptive statistics for each group, including the number of observations N (30 in each group), each group's mean score (New Method = 91.13, Traditional Method = 81.93), standard deviations, and the standard error of the mean. According to the mean scores, students in the New Method group had a higher mean score of 91.13 compared to the Traditional Method students, who had a mean score of 81.93. The difference between the two mean scores is 9.20, favoring the New Method group. Figure 7 exhibits a bar plot of the mean scores of students math tests taught by the Traditional and the New methods.
But is a 9.20 difference in mean scores statistically significant? We can determine this by referring to the independent samples test table. The second table in the SPSS output shows the results of the independent samples t-test (Figure 8).
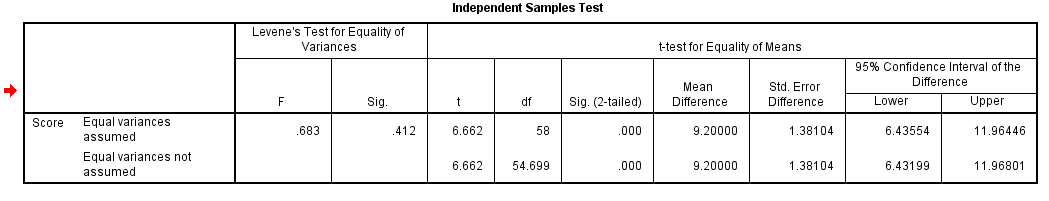
SPSS provides two separate rows of results for the independent samples t-test. The choice of which row to report depends on whether the variances between the two groups are equal. If the variances of the scores in both groups are equal, we use the first row; otherwise, we use the second row.
The equality of variance is determined by Levene’s test found in the second column. If Levene’s test is not significant, it indicates no difference exists between the variances of the groups, so we report the first row for the t-test results. In our example, Levene’s test is not significant, so we report the first row. The t value is 6.662 with 58 degrees of freedom and a p-value of 0.00, which is below the significance level of 0.05 (two-tailed). Thus, we conclude that a 9.20-point difference in mean values is statistically significant, with students in the New Teaching Method group outperforming those in the Traditional Method group.
Additionally, we can base our conclusion on the confidence interval of the difference. Our null hypothesis assumes no difference, meaning the group means are the same, and the difference is zero. Since the null value of 0 is not within the confidence interval of 6.435 to 11.964, we conclude that the difference between group means is a value other than 0, which we estimate to be between 6.435 and 11.964 in 95% of cases. Therefore, the 9.20-point difference, which falls within this interval, is not due to chance and is statistically significant.
Reporting the Results of Independent Samples T-Test
In this research, we were interested in knowing the effectiveness of a new mathematics teaching method. A random sample of students were recruited and randomly assigned to the New Teaching method (N = 30) and the Traditional Teaching method (N = 30). At the end of the program, both groups took a common math test. The New Teaching Method group (N = 30) had a mean math score (M) of 91.13, with a standard deviation (SD) of 10.45. The Traditional Teaching Method group (N = 30) had a mean math score (M) of 81.93, with a standard deviation (SD) of 12.08.
An independent samples t-test was conducted to compare math scores between the New Teaching Method group and the Traditional Teaching Method group. There was a significant difference in scores between the two groups, t(58) = 6.662, p < 0.001. The 95% confidence interval for the difference between the means was 6.435 to 11.964, indicating that the difference of 9.20 points in mean values was statistically significant.
The results suggest that the new teaching method is significantly more effective in improving students' math scores compared to the traditional teaching method. Students taught with the new method scored, on average, 9.20 points higher than those taught with the traditional method. This finding supports the hypothesis that the new teaching method enhances math performance.